When making an investment decision, the fiduciary duty of an asset manager includes addressing a company's climate exposure and its adaptive strategy. For investors, understanding this dynamic and recognizing the financial threat is crucial.
June 11, 2024
The Paris Agreement has intensified the push towards a low-carbon economy, with net-zero targets becoming a focal point. Smoothing the path to net-zero will demand an alignment of policy, investment, and innovation. As concluded by the COP28 global stockstake report, government actions do not necessarily match the scientific emergency. Nevertheless, when making an investment decision, the fiduciary duty of an asset manager includes addressing a company's climate exposure and its adaptive strategy. For investors, understanding this dynamic and recognizing the financial threat is crucial.
Companies face various climate-related financial implications, including physical risks affecting assets and operations, and transition risks that could alter their profitability and business model viability.
To make an informed decision an investor must assess how strong a company's climate action plan, its decarbonization strategy, and its implementation are.
Having said that, evaluating a net-zero transition plan is challenging. First, in the real economy, transition is quite costly and does not happen overnight. Secondly, complexity arises from the significant number of assumptions required to establish an all-encompassing net-zero framework and the lack of standardized and complete data currently disclosed.
To gauge a company's readiness for a low-carbon future, a systematic and industry-specific approach is essential, considering the distinct challenges and opportunities each sector faces in achieving net-zero emissions. For instance, for service industries the transition may be a clear-cut approach, whereas in 'hard-to-abate' sectors, such as cement or aluminum production, the path to net-zero is inherently more multi factor and relies on new technology development.
Computing a transition score
As companies do not start from the same point and will use different steps to decarbonize, a transition score can help investors assess if a company’s transition plan is aligned on achieving its net zero plan in the real economy.
We have compiled different publicly available data sources, each assessing the strength of different steps, to systematically generate objective indicators and compute a theoretical transition score. The objective is to end up with a large enough eligible universe to construct a robust risk-adjusted portfolio of credible transitioning companies.
To cover all recognized and required characteristics we processed most recognized transition frameworks1, which leaves us with three main questions to be addressed about the plan:
- Existence – is there a plan?
- Achievability – of the objective and when
- Deliverability - governance, investment, and financing
1. Is there a plan?
Decarbonization targets that aim to reach net-zero are a useful marker to assess emissions-reduction commitments. Moreover, aligning near-term targets with long-term climate goals are essential for achieving long-term net-zero pledges. Additionally, as companies have rushed to set 2050-linked pledges, a robust investment strategy requires to focus on immediate targets.
We use the SBTi2 near term targets to assess if a company outlined a transition plan. If the company lacks a short-term target, there should be a questioning about its eligibility as a transitioning candidate.
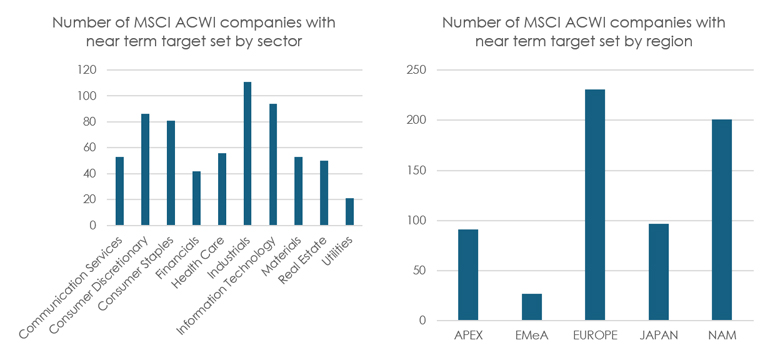
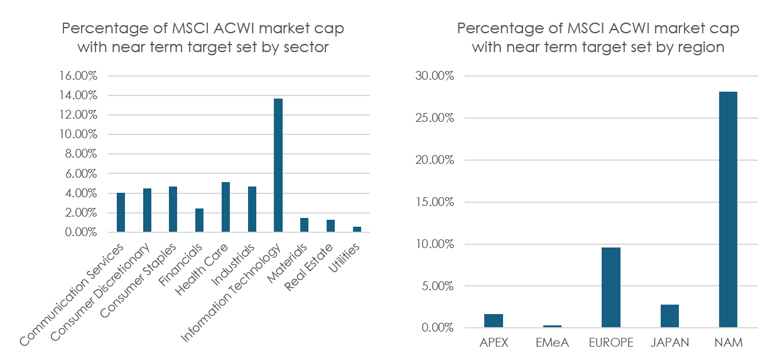
The science-based target initiative (SBTi) revises companies’ voluntary targets and has approved companies’ short-term targets and considers them as “committed”. Out of the 2700 companies in the MSCI ACWI index, about 650 have a validated target.
Figure 1: Companies with SBTi near term targets
Source: Asteria, SBTI, MSCI. Data as of April 30 2024.
Data highlights:
- There are no energy companies with near-term targets and very few utilities
- Industrials have the highest number of committed companies together with IT
- Regionally, the number of European companies outweighs North Americans and there are very few companies in Emerging Markets including China
2. Is the objective achievable and by when?
In alignment with the 2050 target for achieving net-zero emissions, we have developed a metric termed 'net zero duration' to evaluate the temporal framework required for a company to attain this goal.
This metric is derived by juxtaposing the company's projected timeline to reach net-zero emissions, based on its current and anticipated carbon intensity, against the benchmark year established by the firm.
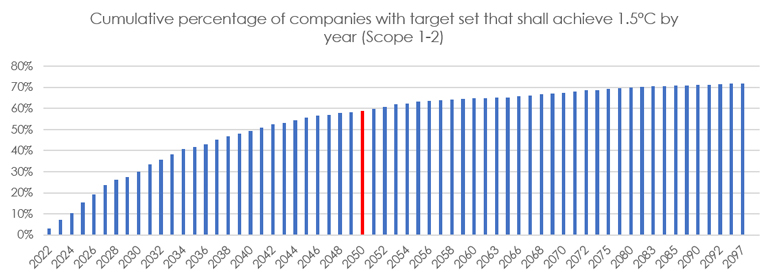
This benchmark is informed by emission trajectories compatible with limiting global warming to 1.5°C above pre-industrial levels. Our analysis is confined to scope 1 and 2 emissions, as the inclusion of scope 3 emissions reveals that, for the median company, the realization of net-zero plans appears implausible before the year 2100 under current strategies.
Figure 2: Year of achievement of the 1.5°C scenario for companies with target set
Source: Asteria, SBTi, TruCost. Data as of April 30th 2024.
When computing the data, we find that only 60% of companies with near-term target shall in fact be able to achieve their target by 2050.
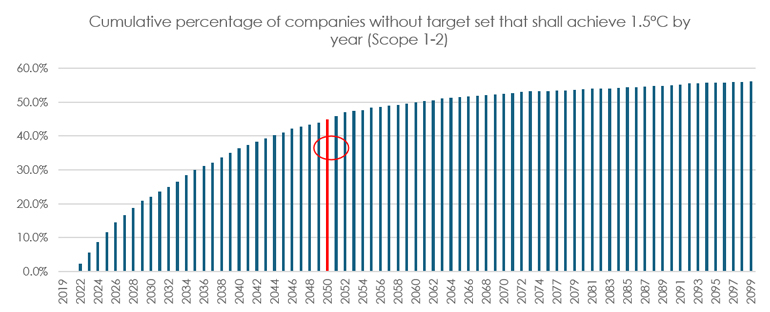
We have run the identical data set on those MSCI ACWI constituents which have not set a short-term target. There are over 40% of those companies showing decarbonization trends that could be aligned with a 2050 target.
Figure 3: Year of achievement of the 1.5°C scenario for companies with no target set
Source: Asteria, SBTi, TruCost. Data as of April 30th 2024.
This represents a large pool of opportunities, and we should therefore not exclude a transitioning candidate based on the absence of a SBTi validated target. It might be a lack of internal resources and capabilities such as for SMEs or in certain geographies such as Asia-Pacific.
3. Is the plan deliverable?
As for any strategic business decision, good governance around climate-related risks and opportunities plays a crucial role in delivering a net zero plan. It involves setting clear indicators including whether a company has a climate-change policy in place, to what extent it discloses its emissions, and whether the company has allocated board responsibility for climate change.
Management quality
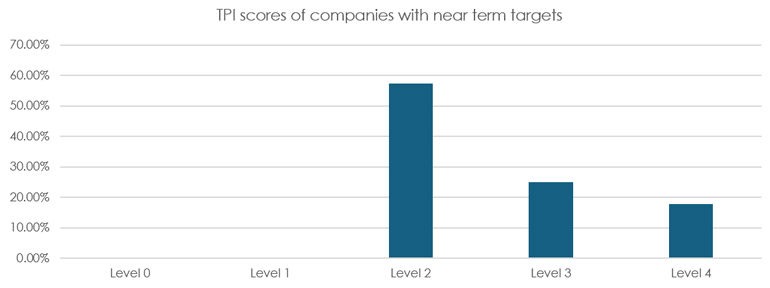
To assess the companies’ actions in terms of transition strategy and governance, we use the TPI managerial scores3. Companies’ management quality is assessed against a series of indicators, covering issues such as company policy, emissions reporting and verification, targets, strategic risk assessment and executive remuneration and rank from 0 to 4 being the best level. Other TPI data could be used if necessary if we want to put more emphasis on some specific corporate actions.
Figure 4: TPI management quality score for companies with SBTi near term targets
Source: Asteria, SBTi, TPI. Data as of April 30th 2024.
Data highlights:
- Less than 7.5% of companies with near term targets have a score of 5 and less than 20% a score above average (3)
- The main issues are the lack of climate KPIs in compensation and the absence of considerations for climate change risks and opportunities in the firm’s strategy
Company’s investment plan
In sector where transition is the most capital intensive, we should expect to see sufficient financing directed towards the decarbonization process.
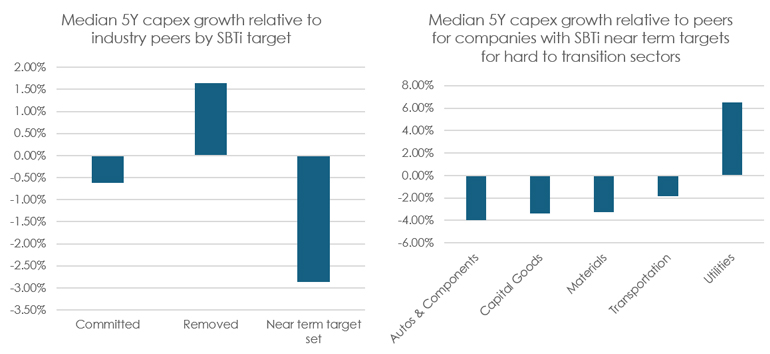
For the following sectors: Energy, Materials, Autos, Capital Goods, Utilities, and Transportation, we will require significant capex to transition by using the 5Y annualized capex growth relative to industry peers. Ultimately Green Capex (if available and reliable) will be a far better alternative.
Figure 5: Excess 5Y capex growth relative to peers
Source: Asteria, SBTi, S&P Capital IQ. Data as of April 30th 2024.
Data highlights:
- The 5Y capex growth of companies that have set near-term target was 3% lower than for their median peer which could question the alignment of the business strategy with a climate plan
- Utility companies seem to walk the talk whilst autos do not
- There are some companies with high capex growth in materials, transportation, and capital goods
Financing the plan
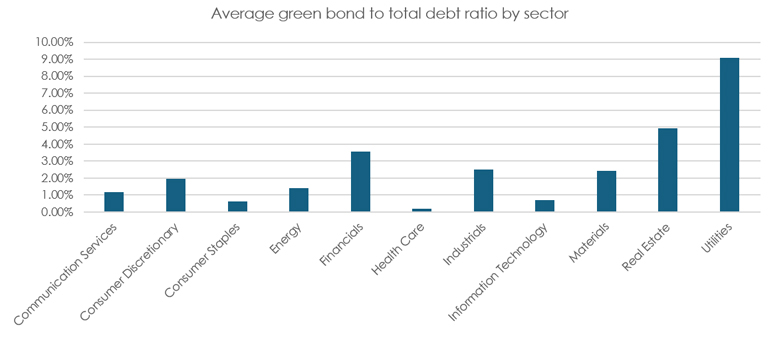
Having identified potential investment plans, the question arises about the company’s ability to finance these plans. Given that proceeds from green bonds must be allocated to environmental programs, we consider these issuances as an excellent proxy for assessing the ability of a company to finance it’s low-carbon transition ambitions. We analyzed the issuers of green bonds per sectors and their alignment with existing plans.
Data highlights:
- Highest green bond to total outstanding debt ratio: REITS, Utilities, and Financials
- Lowest green bond to total outstanding debt: Healthcare, Consumer Staples, and IT
- Highest mean percentage for European companies (7%) versus <2% for North American ones
- 20.7% of the MSCI ACWI market cap that have issued green bonds
Figure 6: Ratio of total notional amount of green bond to total notional debt outstanding
Source: Asteria, ICE. Data as of April 30th 2024.
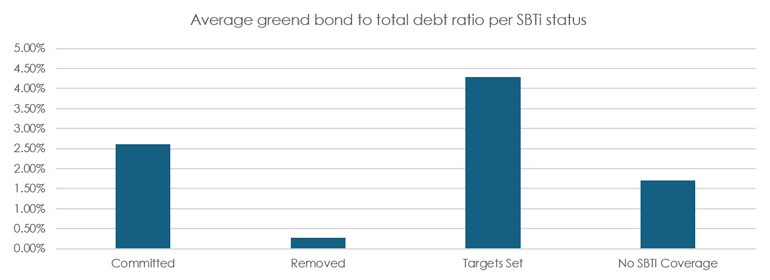
Figure 7: Ratio of total notional amount of green bond to total notional debt outstanding per SBTi status
Source: Asteria, ICE. Data as of April 30th 2024.
When organizing the Green Bond issuers by target setters, we are happy to notice that companies with near term targets issue relatively more green bonds implying an alignment with the business strategy shift.
Capital allocation with sufficient diversification
A transition score will help allocate capital towards companies with high transition score and improve diversification by adding hard-to-abate but necessary activities to achieve the transition to net zero. Build a portfolio that is both adapted and supporting the real economy’s transition efforts.
When identifying transitioning candidate, both the transition strategy and its implementation need to be assessed.
Case studies
Microsoft
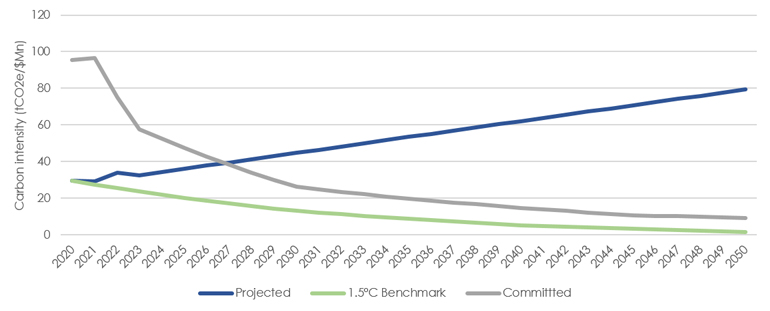
The IT company excels in strategic planning and management quality; however, implementation metrics reveal a misalignment in recent years, as evidenced by the latest carbon emission reports. Despite its 2020 commitment to become carbon negative by 2030—removing more carbon than it emits—emissions have increased. This goal is becoming increasingly challenging as the company remains a leader in the generative AI sector, an activity with significant energy demands.
Figure 8: Carbon intensity trajectory for Microsoft (scope 1-2)
Source: Asteria, TruCost, IPCC. Data as of December 31st 2023.
Holcim
The cement industry, a hard-to-abate activity, emits up to 8% of global CO2 emissions. Holcim is committed to leading the green transformation of cement.
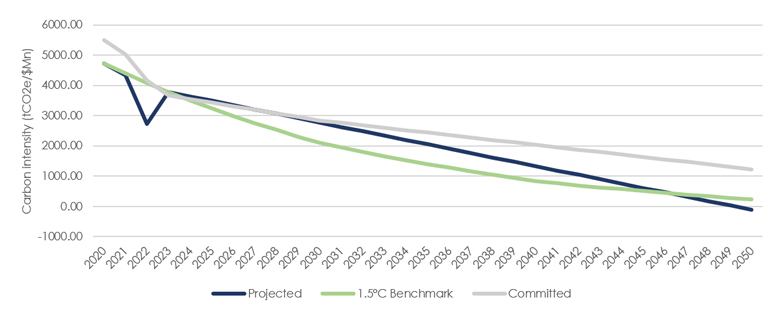
The company has also a very good score of the strategy and management quality, which is confirmed by the quantitative indicators of carbon intensity reduction figures as well as the pathway and the pace. For the second year in a row, Holcim has been ranked as a global climate leader on CDP’s ‘A List’ for tackling climate change. This results from both innovation and promoting low-carbon products as well as divesting some of its more polluting assets.
Figure 9: Carbon intensity trajectory for Holcim (scope 1-2)
Source: Asteria, TruCost, IPCC. Data as of December 31st 2023.
Conclusion
This transition score 1.0 is the first attempt to organize existing data to systematically assess a transition plan objectively. It has the advantage of being simple, tractable, and fact driven. The main drawback of our methodology is its reliability on external data, which may contain errors and do not update very frequently.
As the development of disclosure frameworks, data collection standards and regulations will create more transparency and facilitate data collection.
We are convinced that integration of scope 3 emissions and green capex will help refine the selection of companies in a portfolio realizing real world decarbonization for investors with goals to control their financed emissions and actively contribute towards the Paris Agreement goals.
1. UN HLEG; OECD; CDP or TPT
2. Science Based Target Initiative
3. 2021-methodology-report-management-quality-and-carbon-performance-version-4-0 (transitionpathwayinitiative.org)
You are now leaving Man Group’s website
You are leaving Asteria Investment Managers’s website and entering a third-party website that is not controlled, maintained, or monitored by Asteria Investment Managers. Asteria Investment Managers is not responsible for the content or availability of the third-party website. By leaving Asteria Investment Managers’s website, you will be subject to the third-party website’s terms, policies and/or notices, including those related to privacy and security, as applicable.