2024 was a politically eventful year: Right-wing populist parties made significant gains in the European Parliament election, both the U.K. and the U.S. saw changes in government, and the German chancellor called for a snap general election to be held in February 2025.
January 21, 2025
Green investments: Challenges of 2024 and Opportunities for 2025
2024 was a politically eventful year: Right-wing populist parties made significant gains in the European Parliament election, both the U.K. and the U.S. saw changes in government, and the German chancellor called for a snap general election to be held in February 2025. Despite these political developments, global equity markets performed strongly, supported by robust economic growth and easing inflation. However, financial market performance remained heavily skewed toward U.S. mega-capitalization companies.
In this note, we will first review the performance of green investments in 2024 before presenting our outlook for 2025.
Executive Summary
In 2024, green companies faced significant headwinds, underperforming broader equity markets due to both structural challenges within key sectors and the dominance of U.S. mega-cap technology companies.
Looking ahead to 2025, we see opportunities in themes such as waste management, power distribution, water efficiency, and sustainable building materials, which are positioned to outperform despite analyst skepticism in some areas. However, structural challenges are likely to persist in power storage, sustainable forestry, and alternative energy production, leading us to remain cautious on these themes.
The broader political backdrop, particularly the policies of President-elect Donald Trump, introduces additional uncertainty. While trade tariffs are expected to have a neutral impact overall, specific sectors such as electric vehicles, semiconductors, and green metals remain highly sensitive. On the other hand, potential corporate tax cuts could create tailwinds for U.S. mid- and small-cap companies, which are already trading at attractive valuations relative to their larger peers.
Finally, with the equally weighted S&P 500 underperforming the cap-weighted index for nearly a decade, there is significant potential for performance reversion in favor of smaller and mid-sized companies. This, combined with the attractive pricing of certain environmental themes, underpins our optimism for targeted opportunities in 2025.
What happened in 2024?
As a reminder, typical SDFR article 9 funds with environmental impact targets are tilted towards utility companies, industrials, information technology (semis), and materials. They are also significantly under-weighted in financials and have no exposure to the energy sector. Finally, they have a low exposure to US mega technology companies.
Figure 1: Environmental impact activities
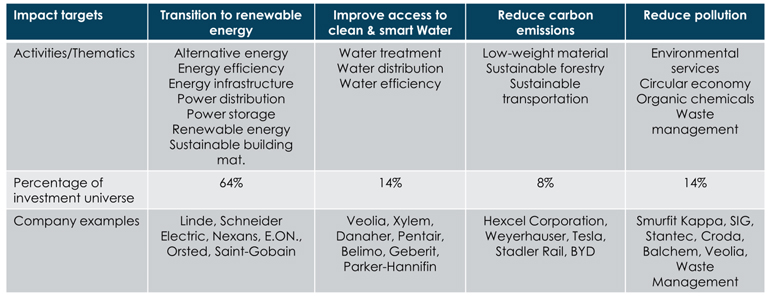
Source: Asteria IM.
2024 was a challenging year for companies providing environmental solutions. As shown in Figure 2, the (revenue-weighted) relative performance of our thematic universes highlights that most of them underperformed the MSCI ACWI Net Total Return Index. The only exception was the decarbonization basket, which benefited from Tesla’s remarkable performance following the outcome of the U.S. election.
This underperformance was partly driven by the dominance of U.S. mega-cap technology companies, which significantly outperformed the broader market. Nonetheless, there was considerable variation in performance across the main impact themes:
- Renewable Energy: Power storage and alternative energy production faced the greatest challenges. The utility battery industry (power storage) struggled with persistent overcapacity, forcing companies to sell at very low margins. In the alternative energy sector, offshore wind was hit hardest due to project cancellations, which triggered significant write-downs, and ongoing political uncertainty. In contrast, sustainable building material companies performed close to market levels.
- Water: The underperformance of this theme was primarily driven by difficulties faced by companies providing water treatment, cleaning, and testing solutions. However, water distributors and technology firms specializing in metering performed relatively well.
- Pollution Reduction: Organic chemicals companies were the main detractors in this category, continuing to suffer from excess supply caused by overcapacity among Chinese producers.
- Sustainable Transportation: While demand for electric vehicles (EVs) continued to grow, the pace of adoption slowed. Tesla’s strong performance was entirely driven by optimism following the U.S. election rather than robust company fundamentals. Excluding Tesla, the theme also struggled due to the poor performance of sustainable forestry and public transportation companies.
Figure 2: Relative performance of impact themes for 2024
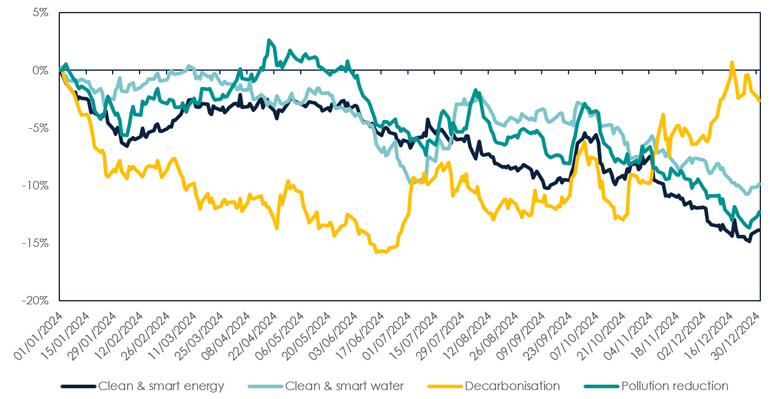
Source: Asteria Investment Managers, and Bloomberg. Benchmark: MSCI ACWI net total return. Performance relative to MSCI ACWI is green revenue- weighted, gross of fees. Period under review: January 1 to December 31 2024.
Positioning for 2025: Opportunities challenges in green Investing
How does the green opportunity set look like?
Figure 3 highlights the median PEG ratio for the constituents of green investment universes, alongside the value-weighted PEG ratio of the MSCI ACWI index. The data shows that power storage, sustainable transportation, and low-weight materials are currently priced at attractive valuation levels. In contrast, waste management and certain segments of the water theme appear relatively expensive.
However, in the near term, we do not anticipate a recovery in power storage, renewable energy, or sustainable transportation. Structural challenges, such as persistent overcapacity and ongoing political uncertainties, are likely to continue weighing on these sectors. Additionally, we expect further downward revisions to growth forecasts for these areas, which will likely extend the period of underperformance.
Figure 3: PEG ratio of the environmental impact universe
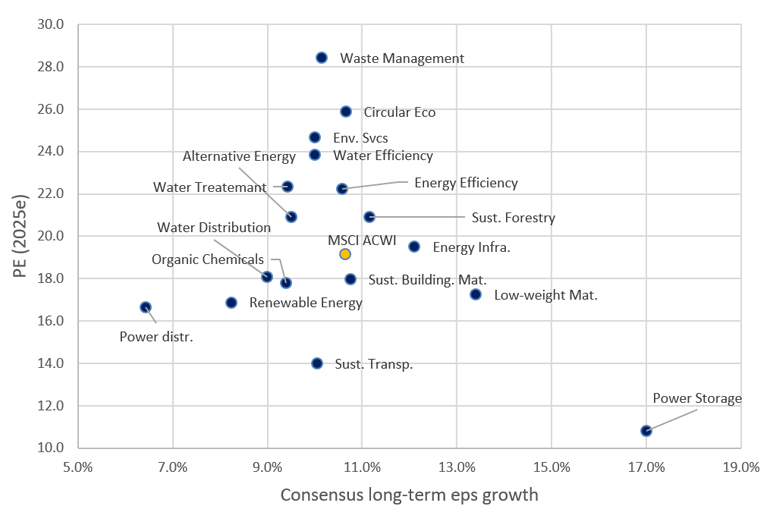
Source: Asteria IM and S&P Capital IQ. Median values are used for the impact universe. The MSCI ACWI index ratios are value-weighted. Calculation date: December 31st 2024.
Where do we see potential for alpha creation?
Our selection model forecasts that several themes within our investment universe are likely to outperform the market in 2025. Figure 4 illustrates the median rank of our systematic expected alpha estimates for these impact activities on the y-axis, alongside the median expected returns implied by analysts' consensus price targets. For comparison, we also include the value-weighted estimates for the MSCI ACWI.
According to our analysis, we anticipate that waste management, power distribution, water efficiency, and sustainable building materials will deliver strong relative performance. However, analysts’ consensus diverges somewhat from our view, particularly regarding waste management and power distribution.
Conversely, we remain pessimistic about the prospects for power storage, sustainable forestry, and alternative energy producers, where structural challenges persist. On these themes, our outlook is less optimistic than the consensus, particularly for power storage and sustainable forestry.
Figure 4: Asteria’s proprietary alpha forecasts versus analysts’ expected return forecasts
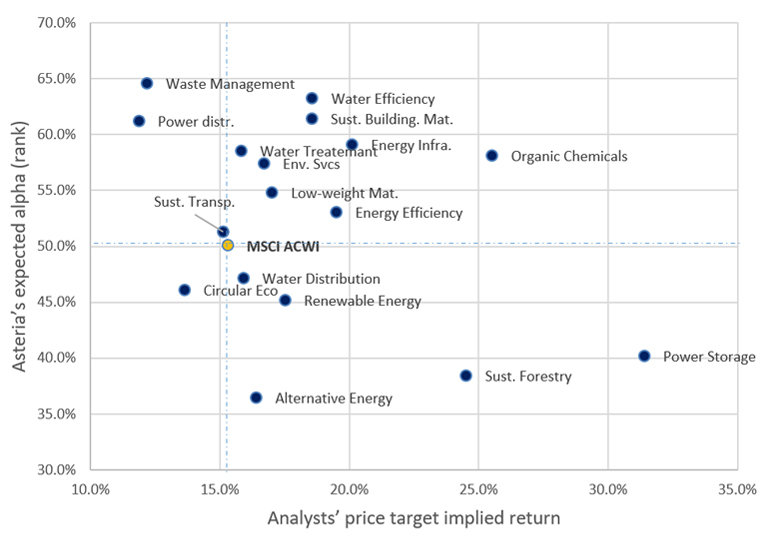
Source: Asteria IM and S&P Capital IQ. The y-axis reports the median rank of our proprietary expected alpha. The x-axis reports the median implied expected return of analysts’ consensus price targets. It is obtained by computing the percentage difference between the price of each company as of December 31st and the last available consensus price target for the company. For the MSCI ACWI, both the expected alpha and the expected return implied from price targets are value weighted.
How will Trump 2.0 impact green investments?
A key concern as we enter 2025 is the potential impact of President-elect Donald Trump’s policies on green investment universes. While political actions are inherently difficult to predict and model, we anticipate that the effect of potential trade tariff increases will be neutral overall. To assess this, we utilized our internal large language model to derive sensitivity scores for each company in the opportunity set and the MSCI ACWI, ranging from 1 (low sensitivity) to 5 (high sensitivity). These scores were then grouped by impact themes, and average scores were calculated.
As shown in Figure 5, the decarbonization universe and parts of the clean and smart energy universe exhibit significant sensitivity to trade tariff increases. Within decarbonization, sectors such as electric vehicles, batteries, green steel, green aluminum, and forestry products are particularly exposed. Similarly, semiconductors in the clean and smart energy universe are highly sensitive to tariff changes. In contrast, the water universe is largely immune, while in the pollution reduction category, some organic chemicals providers display elevated sensitivity. As of December 31, 2024, Planet’s value-weighted sensitivity score is slightly lower than that of the MSCI ACWI.
Figure 5: Sensitivity to global trade tariff increases for green investment themes (1 = low, 5 = high)
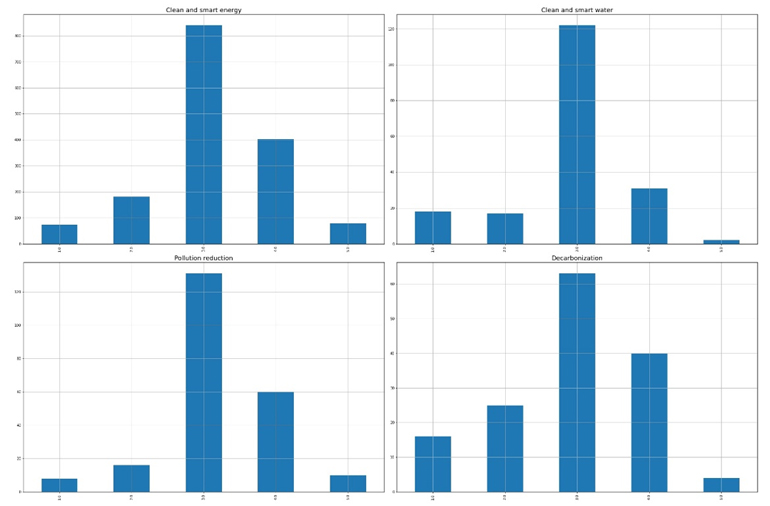
Source: Asteria IM and ManGPT. Calculation date: November 24th 2024.
Additionally, we view potential corporate tax reductions as a positive development for U.S. mid- and small-cap companies. These firms currently face higher effective tax rates compared to large multinational corporations, and any tax cuts would disproportionately benefit them.
Finally, the rise of AI, expanding data center operations, and the deregulation of cryptocurrencies are set to drive higher power demand. While the new U.S. administration's favorable stance on nuclear energy could revive nuclear power projects, the lengthy 15-20 years construction timeline means any significant economic impact on companies in this sector is unlikely to materialize by 2025.
Will US mega-tech continue to outperform?
Although the primary focus of this document is to provide an outlook on environmental impact solution providers, it is important to acknowledge that our relative performance will be influenced by the performance of U.S. mega-cap technology companies. In this regard, we believe that small- and mid-cap stocks currently present a more favorable technical setup compared to their mega-cap counterparts. These smaller companies benefit from cheaper valuations, leaner positioning, and a more cautious market sentiment.
As illustrated in Figure 6, the drawdown of the equally weighted S&P 500 relative to the cap-weighted S&P 500 index has persisted for nearly a decade (117 months). As of December 31, 2024, the price-to-earnings (PE) differential between the two indices stands at 7, indicating a significant opportunity for performance reversion in favor of smaller and mid-sized companies.
Figure 6: Relative drawdown of S&P 500 equally weighted relative to S&P 500 value-weighted index
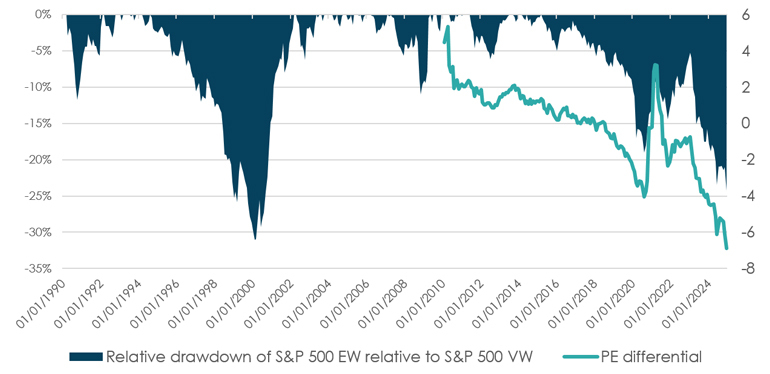
Source: Asteria IM and Bloomberg. Calculation period: January 1990 to December 2024.
You are now leaving Man Group’s website
You are leaving Asteria Investment Managers’s website and entering a third-party website that is not controlled, maintained, or monitored by Asteria Investment Managers. Asteria Investment Managers is not responsible for the content or availability of the third-party website. By leaving Asteria Investment Managers’s website, you will be subject to the third-party website’s terms, policies and/or notices, including those related to privacy and security, as applicable.