The tariff increases planned by President Trump posed significant challenges for equity markets in Q1 2025, increasing uncertainty around global trade and economic growth.
April 4, 2025
Can LLMs reliably predict the sensitivity of firms to tariff increases?
The tariff increases planned by President Trump posed significant challenges for equity markets in Q1 2025, increasing uncertainty around global trade and economic growth. In November 2024, we assessed the sensitivity of our portfolios to global tariff increases to evaluate their relative vulnerability compared to benchmarks and provide investors with insights on potential impacts.
Firm sensitivity to tariffs depends on several factors—such as industry, pricing power, and geographic revenue diversification—which are difficult to quantify across large universes of companies. To address this, we leveraged our internal large language model to estimate sensitivity for an expanded investment universe of 5,000 firms globally. Four months later, we can now draw initial conclusions on the model's effectiveness in measuring tariff sensitivity.
November 2024 results
On November 24th 2024, we prompted our internal LLM (GPT 4o version) as follows:
“You act as a financial analyst and you need to assess the sensitivity of listed companies to a significant increase in trade tariffs between the USA, Europe, and China. I will provide you with listed company names.
Based on this information, I would like you to assess the sensitivity of each firm to increased global trade tariffs over a scale ranging from 1 (very low sensitivity) to 5 (very high sensitivity).
Guide me through your assessment step by step.”
Figure 1 shows the score distribution by industry for the MSCI ACWI universe, highlighting key insights:
- Domestically oriented industries, such as utilities and real estate, have low sensitivity to tariffs, while globally oriented industries, like materials, exhibit higher sensitivity.
- Most industries show significant dispersion across firms, indicating that the model incorporates firm-specific factors beyond just industry classification.
- Minimal dispersion is observed in healthcare, financials, and staples, suggesting potential challenges for the model in capturing firm-specific sensitivities in these sectors.
Figure 1: Distribution of tariff sensitivity scores by industry for MSCI ACWI (1=VERY LOW, 5=VERY HIGH)
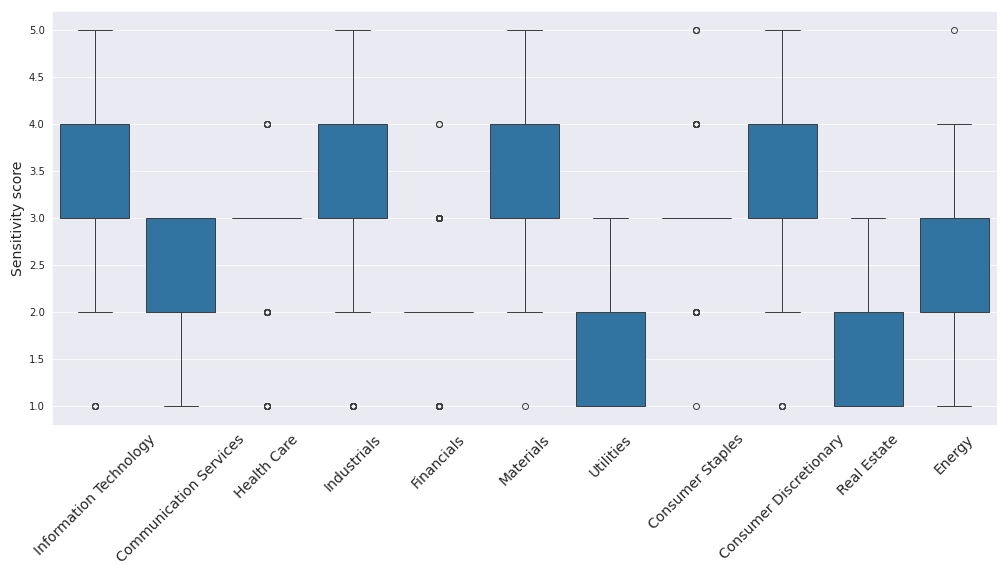
Source: Asteria Investment Managers, MSCI, and ManGPT. Calculation date: November 24th 2024. MSCI ACWI holdings as of March 31st 2025.
Is the tariff sensitivity calculated in November explaining 2025 YTD returns?
Tariff-related headlines weighed on global equity markets throughout Q1, as the US administration announced new tariffs on steel, aluminum, and autos. Uncertainty around the severity of upcoming tariff announcements on 2 April added to the volatility. The MSCI ACWI ended the quarter down 1.3%.
Figure 2 shows the 2025 YTD average performance by tariff sensitivity score bucket. If the score has predictive power, companies with low sensitivity (score = 1) should outperform those with high sensitivity (score = 5). Industry-adjusted performance is also reported to account for sector effects.
The results indicate a negative correlation between YTD returns and tariff sensitivities computed last November, with a rank correlation of -15%. This relationship holds for industry-adjusted returns, suggesting the model effectively captures firm-specific sensitivity beyond industry classification.
Figure 2: Average YTD performance by sensitivity score for the MSCI ACWI universe (as of March 31st)
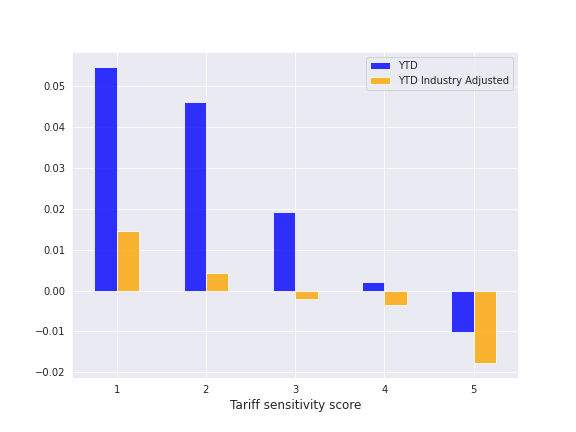
Source: Asteria IM, MSCI, and ManGPT. Calculation date for sensitivity scores: November 24th 2024. Performance and MSCI ACWI holdings are as of March 31st 2025.
Conclusion
This study underscores the remarkable ability of large language models (LLMs) to perform complex tasks at an unprecedented scale. Assessing tariff sensitivity across 5,000 firms globally is a highly intricate task, requiring the integration of multiple interrelated factors such as industry dynamics, geographic revenue diversification, and pricing power. As we showed, the LLM not only handled this complexity but delivered actionable insights efficiently and consistently.
By leveraging LLMs, investors can gain faster, deeper, and more accurate insights, enabling them to make more informed decisions in dynamic and unpredictable environments. This capability positions users of LLMs ahead of those relying on traditional approaches, particularly in todays’ financial markets where speed and scale are critical to maintaining a competitive edge.
You are now leaving Man Group’s website
You are leaving Asteria Investment Managers’s website and entering a third-party website that is not controlled, maintained, or monitored by Asteria Investment Managers. Asteria Investment Managers is not responsible for the content or availability of the third-party website. By leaving Asteria Investment Managers’s website, you will be subject to the third-party website’s terms, policies and/or notices, including those related to privacy and security, as applicable.