Investments in energy companies with lower GHG emissions can significantly contribute to climate protection goals. Regional and lifecycle assessments are however crucial for fair comparisons between renewable and fossil fuel energy generation.
June 6, 2024
Executive summary
Electricity generation currently represents 34% of global greenhouse gases. The shift to renewable energy is essential for mitigating climate change and maintaining global warming within 1.5°C. Investments in energy companies with lower GHG emissions can significantly contribute to climate protection goals. Regional and lifecycle assessments are however crucial for fair comparisons between renewable and fossil fuel energy generation. A company’s avoided emissions intensity offers a valuable metric for prioritizing investments and managing carbon risk in the context of evolving carbon pricing mechanisms. Hence, the impact of these investments varies by country, reflecting the existing energy mixes and policies.
The crucial role of clean energy in climate change mitigation
Energy plays a crucial role in the realization of a 1.5°C pathway since all economic processes rely on its usage. Burning fossil fuels to generate energy and electricity releases greenhouse gases, which drive global climate change.
According to IRENA’s 1.5°C scenario, renewables must grow from 16% of the global energy mix in 2020 to 77% by 20501. For this to happen, annual deployment of about 1000 GW per year is required from 2023 to 2050. Therefore, supportive policies are essential to cultivate a renewable energy system. For instance, Germany aims to increase its share of gross electricity consumption from renewables to at least 80% by 20302. Data from Eurostat confirms that the longer-term trend of Germany’s electricity mix is moving towards more renewables, and we observe the phase-out of nuclear since May 2023. (Figure 1).
Figure 1. Monthly electricity generation mix of Germany
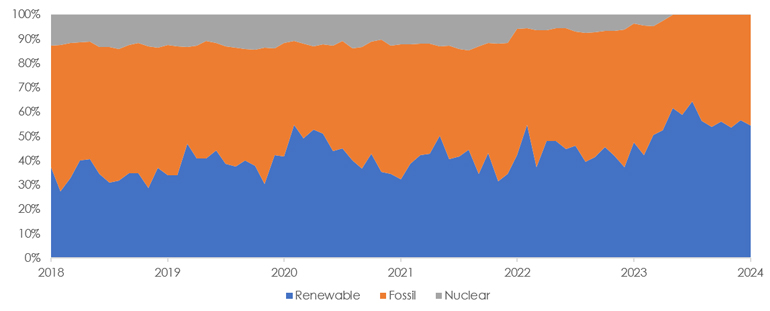
Source: Eurostat, Asteria IM.
Evaluating avoided emissions from cradle to grave
Considering these shifts, investing in entities with an attractive sustainable energy portfolio is a sensible approach. “Attractive” in this context refers to a company’s potential to reduce greenhouse gas emissions compared to a baseline scenario, which varies globally. For any company active in energy generation, we calculate a general indication of avoided emissions with respect to a baseline scenario depending on where in the world the company generates electricity. Whether a company’s energy emissions are higher or lower than its baseline determines whether the contribution made by renewable energy sources to reducing greenhouse gas emissions and achieving climate protection targets is positive.
Since solar or wind power generation does not emit any greenhouse gas emissions while generating power, a fair comparison with fossil fuel power generation can only be done through a lifecycle approach. This way, the setting up of the power plant, maintenance, and decommissioning are included in the calculation of emissions per GWh generated over its lifetime. Figure 2 illustrates this concept, indicating avoided emissions on the bottom right of the figure.
Figure 2. Calculating comparative GHG impacts using the LCA approach
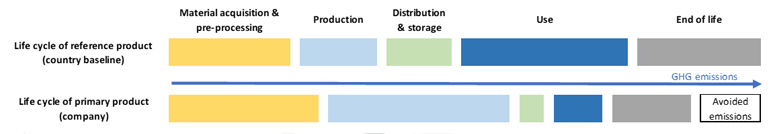
Source: World Resources Institute, Asteria IM.
The country-based power generation data used as reference scenario is sourced from Eurostat and the Energy Institute. Power generation mix data for companies is obtained from S&P Trucost. Finally, lifecycle assessments of GHG emission values for different electricity generation technologies are taken from the IPCC Special Report on Renewable Energy Sources and Climate Change Mitigation. The IPCC reports the distribution of emission values based on 984 references passing a clear screening process. For each energy source, we use the values from the 50th percentile as emission intensity, shown in Table 1. We take this value as to not overly favor one technology over another, as some of the ranges are quite large. The ordering of preference is not influenced much when taking the 25th or 75th percentile across technologies. Evidently, electricity generated from fossil fuels (natural gas, oil and coal) have much larger lifecycle emissions per kWh generated compared to the renewable alternatives.
Table 1. Aggregated results of literature review of LCAs of GHG emissions from electricity generation (gCO2e/kWh)
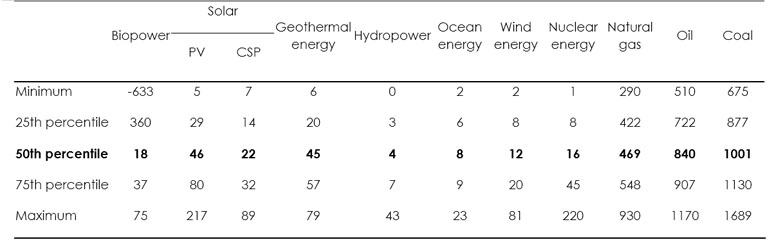
Note: CCS=Carbon capture and storage, PV=Photovoltaic, CSP=Concentrating solar power
Source: Moomaw, W., P. Burgherr, G. Heath, M. Lenzen, J. Nyboer, A. Verbruggen, 2011: Annex II: Methodology. In IPCC Special Report on Renewable Energy Sources and Climate Change Mitigation [O. Edenhofer, R. Pichs-Madruga, Y. Sokona, K. Seyboth, P. Matschoss, S. Kadner, T. Zwickel, P. Eickemeier, G. Hansen, S. Schlömer, C. von Stechow (eds)], Cambridge University Press, Cambridge, United Kingdom and New York, NY, USA
Figure 3 below shows that in the countries covered by Eurostat and part of MSCI World, Germany has the highest lifecycle GHG emissions per GWh generated. It has however been trending down, as shown in the figure on the right-hand side. Sweden is the best performer due to its high generation from hydro, nuclear and wind power. It is barely dependent on fossil fuels. Intuitively this means that owning a renewable energy plant in Germany should be more impactful than owning the same plant in Sweden. Simply because the alternative is more likely to be low emitting anyway in Sweden.
Figure 3. (left) Lifecycle GHG intensity per GWh generated (at 2023-12-31). (right) Germany’s lifecycle GHG intensity per GWh generated, trailing annual values.
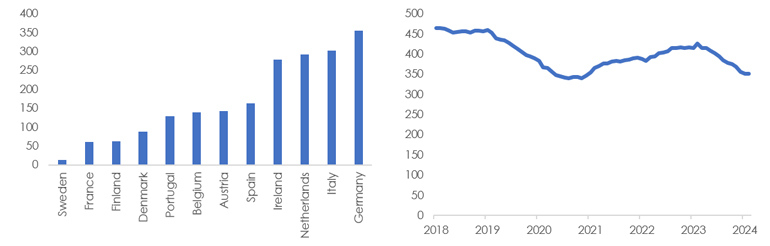
Source: Eurostat, IPCC, Asteria IM.
Another example is a US utility company with all its revenue coming from power generation. Its energy mix is 35% renewable, 39% fossil, 23% nuclear3, with a lifecycle GHG intensity of 205 tCO2e per GWh generated. Since it is active in the US, this intensity is compared to the US value of 398 tCO2e/GWh. Hence, the avoided CO2e attributed to owning this company is 193 tCO2e per GWh generated, even though renewables are less than 50% of its generation capacity. Note that nuclear, with a lifecycle intensity of 16 tCO2e/GWh helps to improve the overall generation intensity of the company. This is similar to how France gets such a low intensity. Whether or not nuclear is sustainable is a discussion that’s separate from its low lifecycle GHG intensity per GWh generated.
In contrast, a Portuguese utility company, with 40% of its revenues from power generation and a 74% renewable mix, appears cleaner. Yet, with half of its fossil fuel generation4 from coal, its total lifecycle GHG intensity is 191 tCO2/GWh. Against Portugal’s baseline intensity of 131 tCO2e/GWh, this results in a negative avoided emissions intensity of -60 tCO2e/GWh. Hence, the company looks cleaner than it is when compared to an appropriate benchmark.
Using avoided emissions in investments
The avoided emissions intensity for energy generation is an important metric to evaluate and prioritize investments into power generation companies or direct investments in power generation assets. It considers the company’s power production mix, along with a suitable reference scenario. A company with 100% renewables in one of the cleanest countries might have a lower avoided emissions intensity than another company with 50% renewables and 50% fossil energy, if it is active in a coal-based country. This approach is relevant for equity and fixed income investments, both in public and private markets.
Increasing the impact of a portfolio being the obvious application, as carbon pricing becomes more prevalent, investment allocation based on avoided emissions intensity could be a strategic approach to managing carbon risk. All the same, as the necessity of location-specific baselines, these evaluations must consider country-specific carbon prices.
Appendix
The calculation of the avoided emissions intensity assumes that the energy mix generated by the company would otherwise have been provided by the energy mix of the country where it is active. When the company’s emissions intensity is lower than the emissions intensity of its country, the company is lowering the country’s electricity-related emissions and had a positive avoided emissions intensity. In contrast, when the company’s emissions intensity is higher than the country average, the avoided emissions intensity is negative and it increases the country’s emissions.
For each country and each year (dependency on the year is omitted to simplify notation), the reference scenario is calculated as
with Gi,j the energy generated (GWh) by technology j in country i and Cj the lifecycle GHG emissions (tCO2e) per GWh of power generated for technology j. We use a lifecycle GHG emissions factor. If you are interested in direct avoidance due to only power production, ignoring building the infrastructure and end-of-life emissions, then a different factor can be used here instead.
Similarly, for any company k in any year, the company’s power generation carbon intensity equals
with H k,j the energy generated (GWh) by technology j by company k.
We combine this to get the avoided emissions intensity for company k active in country i as
The current methodology uses the company’s headquarters’ country as reference energy mix scenario. If more granular data on a company’s energy generation assets is available, each asset can be assigned its specific reference scenario based on its geographic location. This is a straightforward extension.
1. www.irena.org/Publications/2023/Jun/World-Energy-Transitions-Outlook-2023
2. www.bundesregierung.de/breg-de/schwerpunkte/klimaschutz/amendment-of-the-renewables-act-2060448
3. And 3% power generation from undefined sources.
4. The energy mix is 74% renewables, 36% fossil fuels, and 0% nuclear.
You are now leaving Man Group’s website
You are leaving Asteria Investment Managers’s website and entering a third-party website that is not controlled, maintained, or monitored by Asteria Investment Managers. Asteria Investment Managers is not responsible for the content or availability of the third-party website. By leaving Asteria Investment Managers’s website, you will be subject to the third-party website’s terms, policies and/or notices, including those related to privacy and security, as applicable.